

CHERCHER CE QUE VOUS VOULEZ
Industrial RO Power Consumption: How to Estimate kWh per Cubic Meter
Temps:2026-10-20
An industrial reverse osmosis quotation lists a 15 kW high-pressure pump and a permeate capacity of 20 m³/h. Can you divide 15 by 20 and assume the system consumes 0.75 kWh per cubic meter?
Not reliably. The motor rating may not represent actual electrical demand, other equipment may consume additional power, and nominal permeate capacity may differ from usable water delivery.
The most useful energy indicator is specific energy consumption: the electrical energy consumed within a defined system boundary divided by the compliant water produced over the same period.
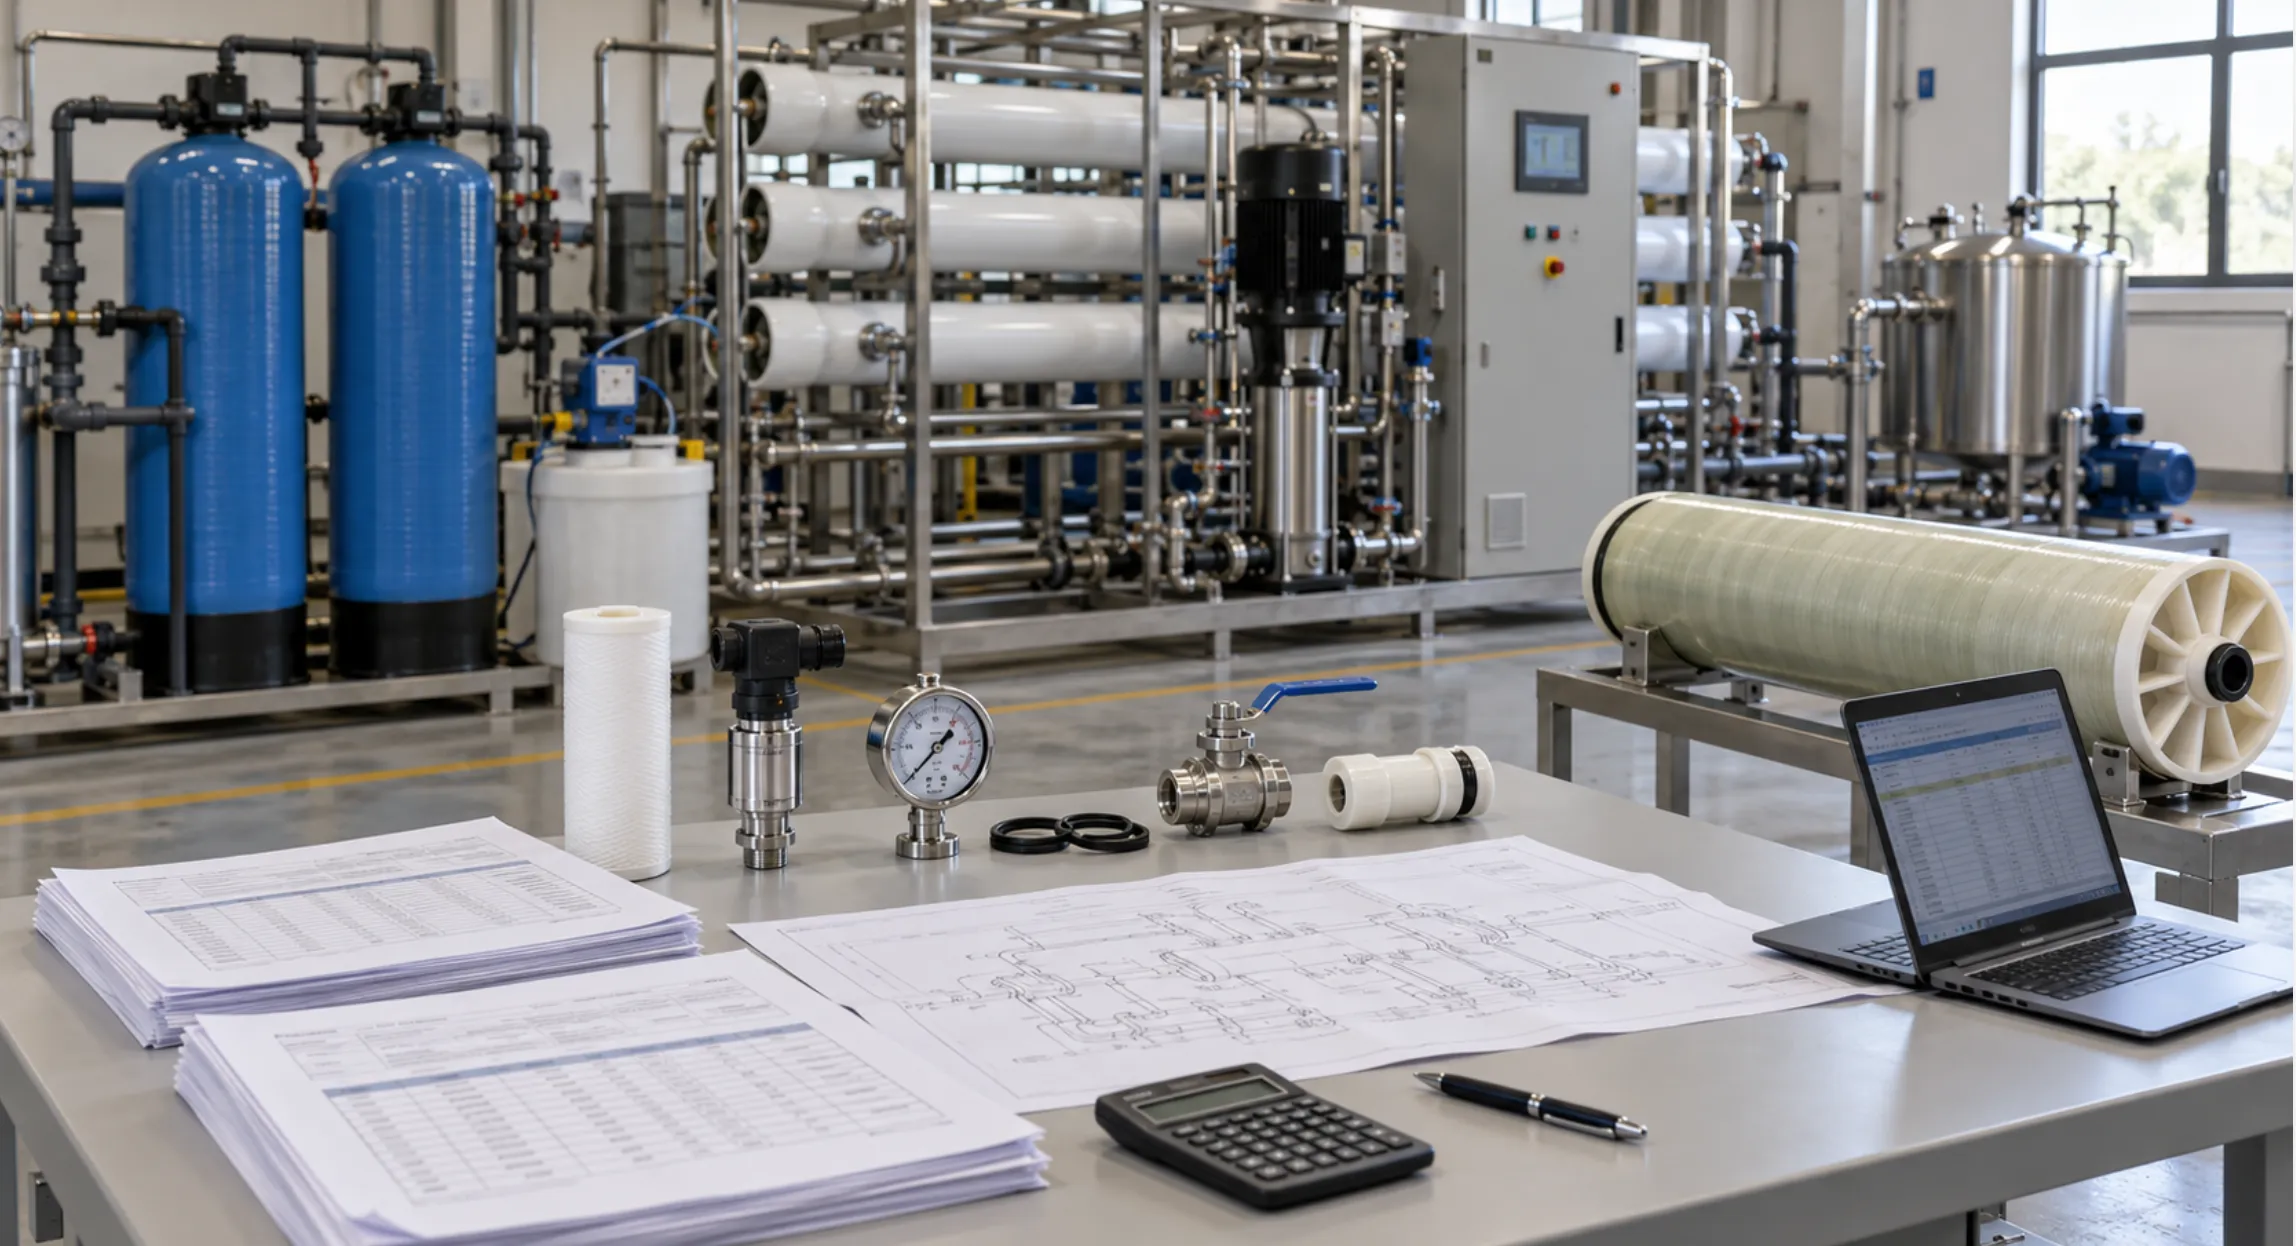
This guide explains how to estimate that figure, identify the assumptions behind it, and compare industrial RO quotations on a consistent basis.
1. Understand the Difference Between kW and kWh/m³
Three quantities are often confused in RO quotations:
| Quantity | Unit | What it tells you |
|---|---|---|
| Electrical input power | kW | The rate at which equipment consumes electrical energy |
| Electrical energy | kWh | The electricity consumed over a period |
| Specific energy consumption, or SEC | kWh/m³ | The electricity consumed per cubic meter of water produced |
The general calculation is:
SEC = Electrical energy consumed (kWh) ÷ Compliant water produced (m³)
For stable operation, it can also be expressed as:
SEC = Actual electrical input power (kW) ÷ Compliant permeate flow (m³/h)
For example, a system drawing 12 kW while producing 20 m³/h has a steady-state SEC of:
12 ÷ 20 = 0.60 kWh/m³
That result applies only to the equipment included in the 12 kW measurement and the water measured at the stated outlet.
For equipment that cycles, changes speed or operates intermittently, measured energy and accumulated water volume provide a more representative result than a single power reading.
2. Define the Energy and Water Measurement Boundaries
Before calculating RO energy consumption, establish what the calculation includes.
A supplier may quote only high-pressure pump energy. A factory may need the electricity required to extract raw water, treat it and deliver it to production. Both figures can be useful, but they describe different boundaries.
| Calculation boundary | Typical electrical loads | Water measurement point |
|---|---|---|
| High-pressure pump only | Pump motor and drive losses | RO permeate outlet |
| RO skid | High-pressure pump, skid-mounted auxiliaries and controls | RO skid product outlet |
| Complete treatment package | Feed pumping, pretreatment, RO and included post-treatment | Final treatment outlet |
| Delivered-water system | Treatment package plus included extraction, transfer or distribution loads | Agreed customer delivery point |
Define the treatment scope precisely. Borehole pumping, a second RO pass, EDI, UV treatment and product-water distribution can all change the final figure.
An energy comparison is meaningful only when both quotations use the same electrical boundary and product-water boundary.
The denominator also matters. Water diverted during startup or consumed internally may not be available to the factory. The distinction is explained in Rated Capacity vs Guaranteed Net Permeate: What RO Buyers Should Confirm.
3. Estimate High-Pressure Pump Electrical Demand
The high-pressure pump is a major electrical load in many RO systems. Its demand depends on the flow passing through it, the pressure increase it provides and the efficiency of the pump, motor and drive.
Grundfos distinguishes hydraulic output from input power and shows that pump efficiency varies with the operating point. This is why pump selection should be based on the actual duty rather than motor size alone.
For a preliminary estimate:
Pump electrical input (kW) ≈ Q × ΔP ÷ (36 × η)
Where:
-
• Q = flow passing through the pump, in m³/h.
-
• ΔP = pressure increase across the pump, in bar.
-
• η = combined pump, motor and drive efficiency, expressed as a decimal.
For a pump driven by a VFD:
η = Pump efficiency × Motor efficiency × VFD efficiency
If the supplier already provides electrical input power at the required duty point, do not apply these efficiency losses again.
Use pump flow, not permeate flow
In a conventional single-pass RO system without concentrate recycle, the high-pressure pump normally handles the RO feed flow.
For 20 m³/h permeate production at 75% recovery:
RO feed flow = 20 ÷ 0.75 = 26.67 m³/h
Using 20 m³/h as the pump flow would underestimate its hydraulic duty.
Systems with recycle, interstage boosting or energy recovery require calculations based on their actual hydraulic arrangement.
Use pressure rise, not discharge pressure alone
If the pump suction pressure is 2 bar and discharge pressure is 14 bar, the pressure increase is approximately 12 bar, assuming elevation and velocity differences are negligible.
The upstream equipment supplying the initial 2 bar still consumes energy. Include that equipment when calculating the complete treatment-package SEC.
Do not substitute motor nameplate power
A motor nameplate rating usually describes rated mechanical output capacity, not the electrical demand at every operating point.
A 15 kW motor does not necessarily draw 15 kW during normal RO operation. Ask for the predicted electrical input at the selected duty point, supported by pump and motor data.
4. Worked Example: A 20 m³/h Industrial RO System
The following example demonstrates the calculation method. It is not a standard consumption value or a recommended operating specification.
Assume a conventional single-pass system without energy recovery:
| Design input | Assumed value |
|---|---|
| Compliant permeate flow | 20 m³/h |
| RO recovery | 75% |
| High-pressure pump flow | 26.67 m³/h |
| Pressure rise across high-pressure pump | 12 bar |
| Pump efficiency | 75% |
| Motor efficiency | 92% |
| VFD efficiency | 97% |
| Other electrical loads during production | 2.0 kW |
Step 1: Calculate combined efficiency
η = 0.75 × 0.92 × 0.97 ≈ 0.669
Step 2: Estimate pump electrical input
Pump input = 26.67 × 12 ÷ (36 × 0.669) ≈ 13.3 kW
Step 3: Add other operating loads
Total operating input = 13.3 + 2.0 = 15.3 kW
The assumed 2.0 kW represents all other loads within the chosen boundary while the system is producing water. Each actual project needs its own equipment schedule.
Step 4: Calculate steady-state SEC
Steady-state SEC = 15.3 ÷ 20 ≈ 0.77 kWh/m³
This describes stable production. It does not yet include the effect of non-production energy consumption or product water used internally.
Step 5: Calculate daily net SEC
Now assume:
-
• Compliant production lasts 22 hours per day.
-
• An additional 6 kWh is consumed outside those production hours.
-
• Internal uses consume 10 m³ of the compliant water produced.
| Daily calculation | Result |
|---|---|
| Production energy: 15.3 × 22 | 336.6 kWh |
| Additional non-production energy | 6.0 kWh |
| Total daily energy | 342.6 kWh |
| Compliant water produced: 20 × 22 | 440 m³ |
| Internal product-water consumption | 10 m³ |
| Net usable water | 430 m³ |
Daily net SEC = 342.6 ÷ 430 ≈ 0.80 kWh/m³
The steady-state figure is approximately 0.77 kWh/m³, while the daily net figure is approximately 0.80 kWh/m³.
Both are valid for their stated boundaries. The daily net figure better represents electricity consumption per cubic meter available for use in this example.
Avoid double counting: energy already included in production-hour consumption should not be added again, and water losses already excluded from the measured delivery volume should not be deducted twice.
5. Why RO Energy Consumption Changes
A single energy figure cannot describe every operating condition. The estimate should reflect the feedwater range, production schedule and equipment condition.
Feedwater salinity and temperature
Higher salinity increases osmotic pressure. Maintaining the required permeate output may therefore require a higher operating pressure.
Colder water reduces membrane water permeability. Maintaining production may also require additional pressure, provided the pump and membranes remain within their limits. DuPont describes pressure, temperature and recovery as factors affecting RO performance.
For seasonal projects, request separate projections for representative and limiting feedwater conditions. How Variable Feedwater TDS Affects RO Pump and Membrane Selection explains why a design based only on average water quality can be misleading.
Recovery rate
At a fixed permeate output, increasing recovery reduces the fresh feedwater volume required. However, it also increases concentration within the membrane system and can raise pressure requirements and scaling risk.
For the simplified arrangement used above:
High-pressure pump SEC ≈ ΔP ÷ (36 × η × Recovery)
Recovery is expressed as a decimal.
This equation does not mean recovery can be increased indefinitely to reduce energy. Pressure, efficiency and membrane operating limits may change as recovery changes.
Recovery should be selected using the water analysis and membrane design, then evaluated for its combined effect on energy, chemical consumption and concentrate volume.
Pump operating point and control method
An oversized pump or unnecessary throttling can increase electricity consumption.
A VFD can help match pump operation to the required duty, but savings depend on the actual pressure and flow requirements. Simple speed-based savings estimates should not be applied blindly to RO service.
For the control considerations, see How VFD Control Improves RO Pump Efficiency and System Stability.
Fouling and hydraulic resistance
Filter blockage, membrane fouling and increasing pressure losses can raise energy consumption per cubic meter.
Depending on the control strategy, the system may draw more power to maintain output or produce less water at similar power.
Compare SEC alongside pressure, flow, temperature and feedwater quality. An increase in SEC alone does not identify the cause.
Operating schedule and system configuration
Frequent starts, prolonged standby operation and low utilization can spread auxiliary energy consumption over a smaller delivered volume.
Second-pass RO and other post-treatment equipment add loads, while energy recovery equipment can change the high-pressure pumping requirement. DuPont identifies energy recovery as an important part of seawater RO configurations.
Systems with different treatment duties should therefore be compared against the same final water specification.
6. Convert kWh/m³ into Electricity Cost
Once the SEC boundary matches the water-delivery requirement:
Electricity cost per m³ = SEC × Electricity tariff
Using the illustrative daily net SEC of 0.80 kWh/m³ and an assumed tariff of USD 0.12/kWh:
Electricity cost = 0.80 × 0.12 = USD 0.096/m³
For 100,000 m³ of annual net production:
Annual electricity cost ≈ 100,000 × 0.80 × 0.12 = USD 9,600
This simplified calculation assumes a flat energy tariff. Demand charges, time-of-use rates and other utility fees require separate treatment.
Electricity cost is only one part of water-production cost. Chemicals, filters, membranes, labor, maintenance, raw water and concentrate management must be evaluated separately.
7. Verify the Estimate with Operating Data
Before installation, SEC is an engineering estimate. After commissioning, it can be checked using measured energy and water volume.
A useful verification procedure should:
-
• Meter the electrical loads within the agreed boundary.
-
• Totalize compliant product water at the agreed outlet.
-
• Record energy and water volume over the same period.
-
• Record feedwater temperature, conductivity, recovery and operating pressure.
-
• Identify startup, flushing, standby and maintenance periods.
-
• Report steady-state SEC separately from daily or longer-term net SEC where needed.
If product water is measured after a storage tank, account for changes in tank inventory. Drawing down stored water can make a short test appear more efficient than the treatment process actually is.
Use a suitable electrical energy meter rather than estimating consumption from motor current alone. Instrument selection and measurement locations should be coordinated with the monitoring plan described in Essential Online Instruments for Automatic Industrial RO Systems.
8. What Buyers Should Request in an RO Quotation
Ask suppliers to provide the assumptions behind their energy figures.
| Item to confirm | Required clarification |
|---|---|
| Energy boundary | High-pressure pump, RO skid or complete treatment package? |
| Water boundary | Gross RO permeate or final net usable water? |
| Design conditions | Feedwater composition, temperature, recovery and product quality |
| Pump duty | Flow, pressure rise and efficiency at the selected operating point |
| Electrical demand | Actual predicted input power versus installed motor capacity |
| Auxiliary loads | Which equipment is included, and for how many hours? |
| Operating cases | Normal, seasonal limiting and part-load conditions, where applicable |
| Verification | Metering points, test period and acceptance conditions |
Also distinguish an estimated SEC from a guaranteed maximum SEC. If energy performance is guaranteed, it should apply together with the agreed output, water quality and recovery under the same test conditions.
For a broader procurement review, use How to Compare Industrial RO System Quotations: 12 Technical Points Buyers Should Check.
Request an RO Design with a Clear Energy Estimate
A useful RO energy estimate connects the feedwater conditions, pump duty, auxiliary loads and actual water delivery. A motor rating alone cannot provide that picture.
Planning an industrial RO project? Send Zhongnuo Water Treatment your raw-water analysis, seasonal water temperature, required hourly and daily output, target water quality and operating schedule. These details help us prepare a suitable system design with a clearly defined electricity-consumption estimate.
An industrial reverse osmosis quotation lists a 15 kW high-pressure pump and a permeate capacity of 20 m³/h. Can you divide 15 by 20 and assume the system consumes 0.75 kWh per cubic meter?
Not reliably. The motor rating may not represent actual electrical demand, other equipment may consume additional power, and nominal permeate capacity may differ from usable water delivery.
The most useful energy indicator is specific energy consumption: the electrical energy consumed within a defined system boundary divided by the compliant water produced over the same period.
This guide explains how to estimate that figure, identify the assumptions behind it, and compare industrial RO quotations on a consistent basis.
1. Understand the Difference Between kW and kWh/m³
Three quantities are often confused in RO quotations:
| Quantity | Unit | What it tells you |
|---|---|---|
| Electrical input power | kW | The rate at which equipment consumes electrical energy |
| Electrical energy | kWh | The electricity consumed over a period |
| Specific energy consumption, or SEC | kWh/m³ | The electricity consumed per cubic meter of water produced |
The general calculation is:
SEC = Electrical energy consumed (kWh) ÷ Compliant water produced (m³)
For stable operation, it can also be expressed as:
SEC = Actual electrical input power (kW) ÷ Compliant permeate flow (m³/h)
For example, a system drawing 12 kW while producing 20 m³/h has a steady-state SEC of:
12 ÷ 20 = 0.60 kWh/m³
That result applies only to the equipment included in the 12 kW measurement and the water measured at the stated outlet.
For equipment that cycles, changes speed or operates intermittently, measured energy and accumulated water volume provide a more representative result than a single power reading.
2. Define the Energy and Water Measurement Boundaries
Before calculating RO energy consumption, establish what the calculation includes.
A supplier may quote only high-pressure pump energy. A factory may need the electricity required to extract raw water, treat it and deliver it to production. Both figures can be useful, but they describe different boundaries.
| Calculation boundary | Typical electrical loads | Water measurement point |
|---|---|---|
| High-pressure pump only | Pump motor and drive losses | RO permeate outlet |
| RO skid | High-pressure pump, skid-mounted auxiliaries and controls | RO skid product outlet |
| Complete treatment package | Feed pumping, pretreatment, RO and included post-treatment | Final treatment outlet |
| Delivered-water system | Treatment package plus included extraction, transfer or distribution loads | Agreed customer delivery point |
Define the treatment scope precisely. Borehole pumping, a second RO pass, EDI, UV treatment and product-water distribution can all change the final figure.
An energy comparison is meaningful only when both quotations use the same electrical boundary and product-water boundary.
The denominator also matters. Water diverted during startup or consumed internally may not be available to the factory. The distinction is explained in Rated Capacity vs Guaranteed Net Permeate: What RO Buyers Should Confirm.
3. Estimate High-Pressure Pump Electrical Demand
The high-pressure pump is a major electrical load in many RO systems. Its demand depends on the flow passing through it, the pressure increase it provides and the efficiency of the pump, motor and drive.
Grundfos distinguishes hydraulic output from input power and shows that pump efficiency varies with the operating point. This is why pump selection should be based on the actual duty rather than motor size alone.
For a preliminary estimate:
Pump electrical input (kW) ≈ Q × ΔP ÷ (36 × η)
Where:
-
• Q = flow passing through the pump, in m³/h.
-
• ΔP = pressure increase across the pump, in bar.
-
• η = combined pump, motor and drive efficiency, expressed as a decimal.
For a pump driven by a VFD:
η = Pump efficiency × Motor efficiency × VFD efficiency
If the supplier already provides electrical input power at the required duty point, do not apply these efficiency losses again.
Use pump flow, not permeate flow
In a conventional single-pass RO system without concentrate recycle, the high-pressure pump normally handles the RO feed flow.
For 20 m³/h permeate production at 75% recovery:
RO feed flow = 20 ÷ 0.75 = 26.67 m³/h
Using 20 m³/h as the pump flow would underestimate its hydraulic duty.
Systems with recycle, interstage boosting or energy recovery require calculations based on their actual hydraulic arrangement.
Use pressure rise, not discharge pressure alone
If the pump suction pressure is 2 bar and discharge pressure is 14 bar, the pressure increase is approximately 12 bar, assuming elevation and velocity differences are negligible.
The upstream equipment supplying the initial 2 bar still consumes energy. Include that equipment when calculating the complete treatment-package SEC.
Do not substitute motor nameplate power
A motor nameplate rating usually describes rated mechanical output capacity, not the electrical demand at every operating point.
A 15 kW motor does not necessarily draw 15 kW during normal RO operation. Ask for the predicted electrical input at the selected duty point, supported by pump and motor data.
4. Worked Example: A 20 m³/h Industrial RO System
The following example demonstrates the calculation method. It is not a standard consumption value or a recommended operating specification.
Assume a conventional single-pass system without energy recovery:
| Design input | Assumed value |
|---|---|
| Compliant permeate flow | 20 m³/h |
| RO recovery | 75% |
| High-pressure pump flow | 26.67 m³/h |
| Pressure rise across high-pressure pump | 12 bar |
| Pump efficiency | 75% |
| Motor efficiency | 92% |
| VFD efficiency | 97% |
| Other electrical loads during production | 2.0 kW |
Step 1: Calculate combined efficiency
η = 0.75 × 0.92 × 0.97 ≈ 0.669
Step 2: Estimate pump electrical input
Pump input = 26.67 × 12 ÷ (36 × 0.669) ≈ 13.3 kW
Step 3: Add other operating loads
Total operating input = 13.3 + 2.0 = 15.3 kW
The assumed 2.0 kW represents all other loads within the chosen boundary while the system is producing water. Each actual project needs its own equipment schedule.
Step 4: Calculate steady-state SEC
Steady-state SEC = 15.3 ÷ 20 ≈ 0.77 kWh/m³
This describes stable production. It does not yet include the effect of non-production energy consumption or product water used internally.
Step 5: Calculate daily net SEC
Now assume:
-
• Compliant production lasts 22 hours per day.
-
• An additional 6 kWh is consumed outside those production hours.
-
• Internal uses consume 10 m³ of the compliant water produced.
| Daily calculation | Result |
|---|---|
| Production energy: 15.3 × 22 | 336.6 kWh |
| Additional non-production energy | 6.0 kWh |
| Total daily energy | 342.6 kWh |
| Compliant water produced: 20 × 22 | 440 m³ |
| Internal product-water consumption | 10 m³ |
| Net usable water | 430 m³ |
Daily net SEC = 342.6 ÷ 430 ≈ 0.80 kWh/m³
The steady-state figure is approximately 0.77 kWh/m³, while the daily net figure is approximately 0.80 kWh/m³.
Both are valid for their stated boundaries. The daily net figure better represents electricity consumption per cubic meter available for use in this example.
Avoid double counting: energy already included in production-hour consumption should not be added again, and water losses already excluded from the measured delivery volume should not be deducted twice.
5. Why RO Energy Consumption Changes
A single energy figure cannot describe every operating condition. The estimate should reflect the feedwater range, production schedule and equipment condition.
Feedwater salinity and temperature
Higher salinity increases osmotic pressure. Maintaining the required permeate output may therefore require a higher operating pressure.
Colder water reduces membrane water permeability. Maintaining production may also require additional pressure, provided the pump and membranes remain within their limits. DuPont describes pressure, temperature and recovery as factors affecting RO performance.
For seasonal projects, request separate projections for representative and limiting feedwater conditions. How Variable Feedwater TDS Affects RO Pump and Membrane Selection explains why a design based only on average water quality can be misleading.
Recovery rate
At a fixed permeate output, increasing recovery reduces the fresh feedwater volume required. However, it also increases concentration within the membrane system and can raise pressure requirements and scaling risk.
For the simplified arrangement used above:
High-pressure pump SEC ≈ ΔP ÷ (36 × η × Recovery)
Recovery is expressed as a decimal.
This equation does not mean recovery can be increased indefinitely to reduce energy. Pressure, efficiency and membrane operating limits may change as recovery changes.
Recovery should be selected using the water analysis and membrane design, then evaluated for its combined effect on energy, chemical consumption and concentrate volume.
Pump operating point and control method
An oversized pump or unnecessary throttling can increase electricity consumption.
A VFD can help match pump operation to the required duty, but savings depend on the actual pressure and flow requirements. Simple speed-based savings estimates should not be applied blindly to RO service.
For the control considerations, see How VFD Control Improves RO Pump Efficiency and System Stability.
Fouling and hydraulic resistance
Filter blockage, membrane fouling and increasing pressure losses can raise energy consumption per cubic meter.
Depending on the control strategy, the system may draw more power to maintain output or produce less water at similar power.
Compare SEC alongside pressure, flow, temperature and feedwater quality. An increase in SEC alone does not identify the cause.
Operating schedule and system configuration
Frequent starts, prolonged standby operation and low utilization can spread auxiliary energy consumption over a smaller delivered volume.
Second-pass RO and other post-treatment equipment add loads, while energy recovery equipment can change the high-pressure pumping requirement. DuPont identifies energy recovery as an important part of seawater RO configurations.
Systems with different treatment duties should therefore be compared against the same final water specification.
6. Convert kWh/m³ into Electricity Cost
Once the SEC boundary matches the water-delivery requirement:
Electricity cost per m³ = SEC × Electricity tariff
Using the illustrative daily net SEC of 0.80 kWh/m³ and an assumed tariff of USD 0.12/kWh:
Electricity cost = 0.80 × 0.12 = USD 0.096/m³
For 100,000 m³ of annual net production:
Annual electricity cost ≈ 100,000 × 0.80 × 0.12 = USD 9,600
This simplified calculation assumes a flat energy tariff. Demand charges, time-of-use rates and other utility fees require separate treatment.
Electricity cost is only one part of water-production cost. Chemicals, filters, membranes, labor, maintenance, raw water and concentrate management must be evaluated separately.
7. Verify the Estimate with Operating Data
Before installation, SEC is an engineering estimate. After commissioning, it can be checked using measured energy and water volume.
A useful verification procedure should:
-
• Meter the electrical loads within the agreed boundary.
-
• Totalize compliant product water at the agreed outlet.
-
• Record energy and water volume over the same period.
-
• Record feedwater temperature, conductivity, recovery and operating pressure.
-
• Identify startup, flushing, standby and maintenance periods.
-
• Report steady-state SEC separately from daily or longer-term net SEC where needed.
If product water is measured after a storage tank, account for changes in tank inventory. Drawing down stored water can make a short test appear more efficient than the treatment process actually is.
Use a suitable electrical energy meter rather than estimating consumption from motor current alone. Instrument selection and measurement locations should be coordinated with the monitoring plan described in Essential Online Instruments for Automatic Industrial RO Systems.
8. What Buyers Should Request in an RO Quotation
Ask suppliers to provide the assumptions behind their energy figures.
| Item to confirm | Required clarification |
|---|---|
| Energy boundary | High-pressure pump, RO skid or complete treatment package? |
| Water boundary | Gross RO permeate or final net usable water? |
| Design conditions | Feedwater composition, temperature, recovery and product quality |
| Pump duty | Flow, pressure rise and efficiency at the selected operating point |
| Electrical demand | Actual predicted input power versus installed motor capacity |
| Auxiliary loads | Which equipment is included, and for how many hours? |
| Operating cases | Normal, seasonal limiting and part-load conditions, where applicable |
| Verification | Metering points, test period and acceptance conditions |
Also distinguish an estimated SEC from a guaranteed maximum SEC. If energy performance is guaranteed, it should apply together with the agreed output, water quality and recovery under the same test conditions.
For a broader procurement review, use How to Compare Industrial RO System Quotations: 12 Technical Points Buyers Should Check.
Request an RO Design with a Clear Energy Estimate
A useful RO energy estimate connects the feedwater conditions, pump duty, auxiliary loads and actual water delivery. A motor rating alone cannot provide that picture.
Planning an industrial RO project? Send Zhongnuo Water Treatment your raw-water analysis, seasonal water temperature, required hourly and daily output, target water quality and operating schedule. These details help us prepare a suitable system design with a clearly defined electricity-consumption estimate.
Précédent:Plus de données


MESSAGE EN LIGNE
© 2026 Zhongnuo Water Treatment Co., Ltd.